1992 | 1996 | 2000
The American Election of 1992 was a graphics testing ground for the BBC. The live graphics were based partly on Silicon Graphics hardware for the first time, and consequently the programme was the first in the world to incorporate realtime 3D graphics into its output, fed from live results data. As a result, subsequent BBC Election programmes made increasing use of 3D realtime graphics. By 1994, the European Election programme featured full-screen high-definition 3D graphics for Peter Snow’s analysis sequences, and by the time of the 1997 General Election the entire graphics output for results AND analysis was being generated on-the-fly by SGI platforms in 3D.
DECISION 92

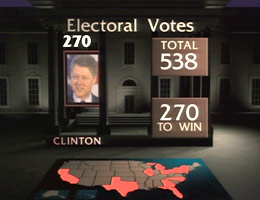
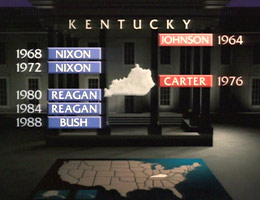
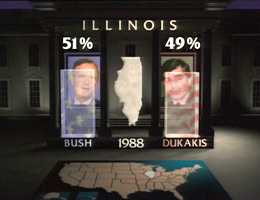
Decision ’92 was the BBC’s overnight programme for the US Election that year. Peter Snow’s analysis graphics were a combination of pre-rendered 3D sequences played out from laser-disc over which were overlaid realtime histograms, line-graphs and other data rendered live from Silicon Graphics hardware.
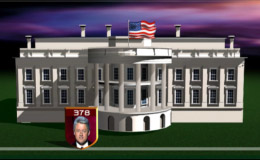
The graphics ‘environment’ was a 3D model of the White House viewed from different angles, in which the content graphics appeared. Pre-made animations allowed us to seamlessly move between individual graphics sequences.
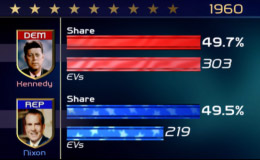
One of the great advantages of having realtime content on screen is that the very latest data can appear instantly for presenter and viewer alike. The downside, of course, is that if for some reason the data that feeds the graphics is incorrect, then the presenter (Peter Snow in this case) can be faced with the unenviable task of explaining to the viewer why Ross Perot appears to be picking up an unlikely number of States. ("If that’s correct, then I’m a Dutchman…")
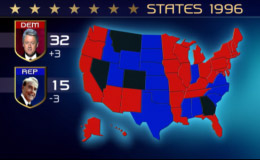
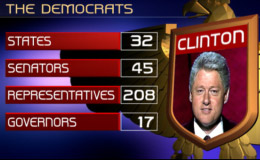
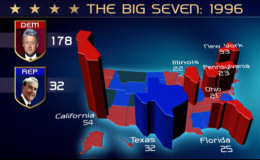
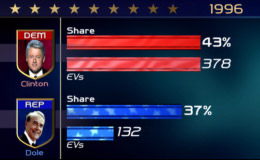
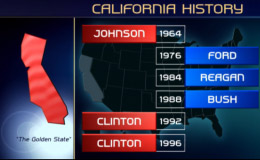
US PRESIDENTIAL ELECTION 1996


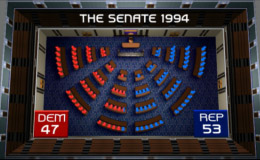
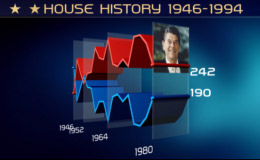
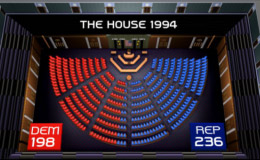
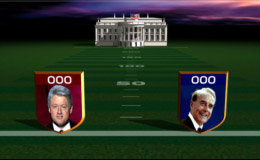
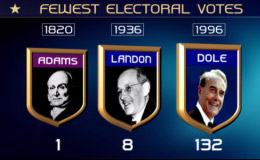
By 1996, we were running our graphics entirely in realtime – the various sequences included a, ‘eagle shield’, a 3D map of the USA with extrudable states, and various line-graphs, histograms, state tallies and historical records – all presented in 3D with seamless transitions within each graphic type.
With a mind to keeping the polygon count down to the bare minimum, I designed a bespoke typeface (Grover Medium, Bold & Italic) in Fontographer – built to have very low complexity – no sefifs, a squarish feel, and crude curves that would appear acceptable at the rendered size.
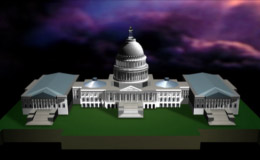
The 3D models of the White House and Congress were built as high detail versions first – then rendered as textures and mapped on to low-poly versions for real-time display. Most of this was done rather painstakingly by hand – before the days of the ‘bake texture’ button.
US PRESIDENTIAL ELECTION 2000
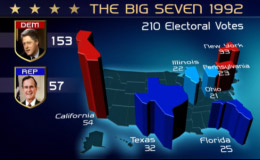
My 1996 US Election graphics were successful enough as a package to run virtually unchanged four years later for the 2000 Presidential race…